

- DXY reverses three daily pullbacks in a row and regains 107.00.
- There are no resistance levels of note until the 2022 top past 109.00.
DXY picks up extra pace and advances to 2-day highs north of the 109.00 yardstick on Tuesday.
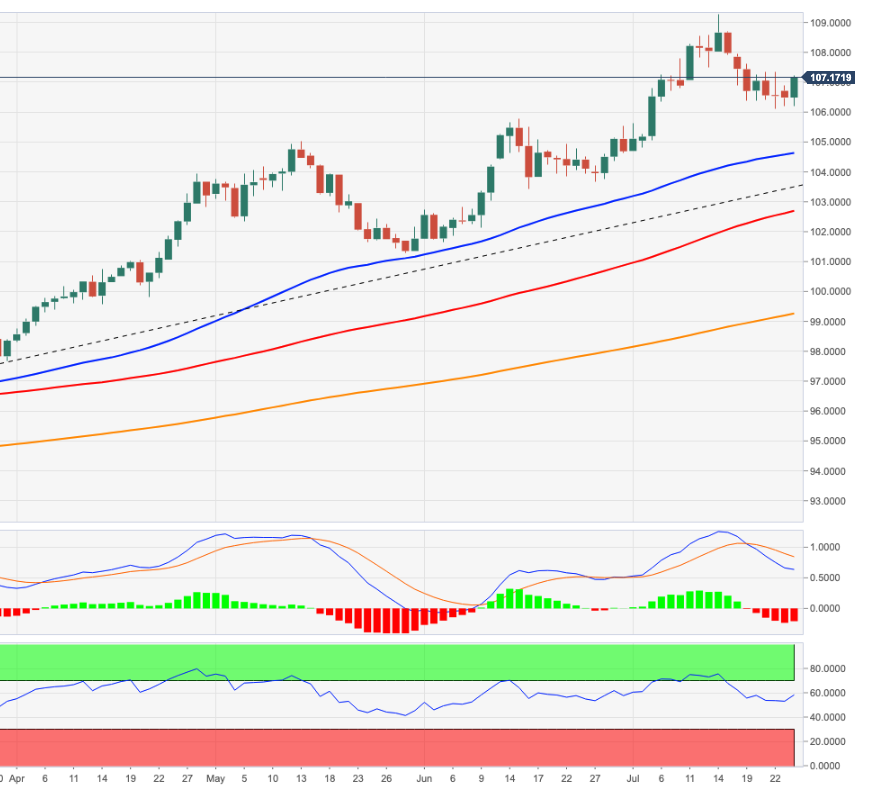
There seems to be strong contention in the 106.00 neighbourhood for the time being, while the next barrier on the upside is not seen before the YTD high near 109.40 (July 14). In case sellers push harder, the index carries the potential to drop further and retest the post-FOMC peak at 105.78 (June 15).
Despite the ongoing downside, the near-term outlookfor DXY is seen constructive while above the 5-month support line near 103.70.
In addition, the broader bullish view remains in place while above the 200-day SMA at 99.25.
DXY daily chart


Không có nhận xét nào:
Đăng nhận xét