

- Gold price snaps two-day uptrend amid sluggish session, easing inside rising wedge bearish chart formation.
- Rebound in yields tease USD buyers ahead of Fed’s preferred inflation gauge.
- Headlines surrounding China, “technical recession” also probe buyers after the biggest daily jump in a week.
Gold price (XAU/USD) fails to extend the two-day uptrend as buyers and sellers jostle around a three-week high during Friday’s Asian session. That said, the precious metal recently eased to $1,754 as the US dollar tracks yield to push back the bearish bias ahead of the key inflation data.
US Dollar Index (DXY) defends 106.00 level while staying near the lowest level since July 05. The greenback gauge dropped during the last two consecutive days amid receding fears of the Fed’s aggression.
On the other hand, a corrective pullback in the US Treasury yields, after refreshing the multi-day low, joins the mixed catalysts surrounding growth to weigh on the XAU/USD prices. That said, the US 10-year Treasury yields seesaw around 2.67%, the lowest levels since early April, whereas the 2-year bond coupons remain pressured at the three-week low, down 0.14% intraday around 2.86% at the latest.
Following Fed Chair Jerome Powell’s teasing of “neutral rates”, gold traders should have traced the Flash readings of the US Q2 GDP, which marked the “technical recession” by declining for the second consecutive time, to cheer the USD dollar weakness and rise further. That said, the first estimations of the US Q2 GDP printed -0.9% Annualized figure versus 0.5% expected and -1.6% prior. Further, the US Initial Jobless Claims also rose more than expected by 253K, with 256K during the week ended on July 22.
Even so, US policymakers, including Fed’s Powell and Treasury Secretary Janet Yellen, tried to shrug off the “technical recession” after the US Q2 GDP dropped for the second consecutive time and teased the concept. The same probes the central bankers pushing for more rate hikes to tame inflation. Furthermore, talks between US President Joe Biden and his Chinese Counterpart Xi Jinping also went mostly okay and exerted downside pressure on the greenback’s safe-haven demand.
Recently, China avoided mentioning its Gross Domestic Product (GDP) target after the Politburo meeting and signaled fears for the XAU/USD traders due to the dragon nation’s status among the world’s top bullion consumers.
Amid these plays, S&P 500 Futures rise half a percent to seesaws near the highest levels since early June.
Looking forward, the Fed’s preferred inflation gauge, namely the Core Personal Consumption Expenditure (PCE) Price Index, expected 0.5% MoM for July versus 0.3% prior, will be important to watch for fresh impulse.
Technical analysis
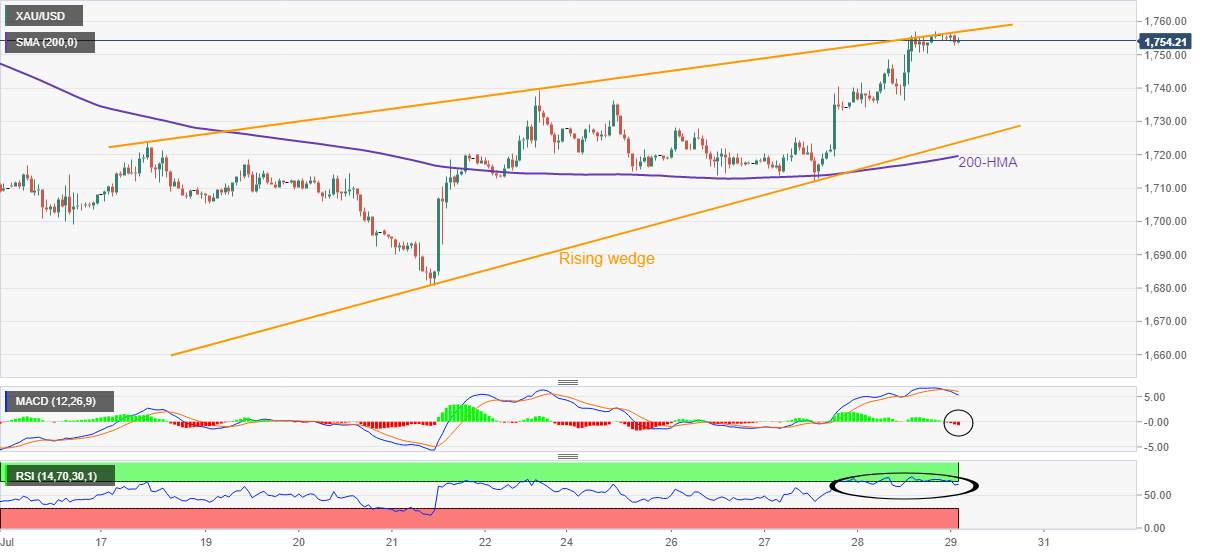
Gold seesaws around the upper line of a fortnight-long rising wedge bearish chart pattern as buyers take a breather.
In addition to the metal’s failure to cross the immediate resistance line, bearish MACD signals and the overbought RSI also hint at the quote’s pullback towards the last Friday’s high near $1,739.
However, the XAU/USD declines past $1,739 will need validation from the stated wedge’s support line and the 200-HMA, respectively near $1,724 and $1,719, to convince bears.
Alternatively, an upside break of the $1,760 hurdle could quickly propel gold price towards May’s low near $1,786 before highlighting the $1,800 threshold.
Overall, gold buyers are likely to witness less acceptance but the sellers also have a long way before taking control.
Gold: Hourly chart
Trend: Pullback expected


Không có nhận xét nào:
Đăng nhận xét